While it is common to monitor deployed clinical artificial intelligence (AI) models for performance degradation, it is less common for the input data to be monitored for data drift – systemic changes to input distributions. However, when real-time evaluation may not be practical (eg., labeling costs) or when gold-labels are automatically generated, we argue that tracking data drift becomes a vital addition for AI deployments. In this work, we perform empirical experiments on real-world medical imaging to evaluate three data drift detection methods’ ability to detect data drift caused (a) naturally (emergence of COVID-19 in X-rays) and (b) synthetically. We find that monitoring performance alone is not a good proxy for detecting data drift and that drift-detection heavily depends on sample size and patient features. Our work discusses the need and utility of data drift detection in various scenarios and highlights gaps in knowledge for the practical application of existing methods.
As the number of artificial intelligence (AI) tools in medicine grows, patients may increasingly be evaluated by physicians who employ a wide gamut of supportive clinical machine learning algorithms. To ensure the safe use of these algorithms, researchers and practitioners are developing a wide-set of evaluative and deployment best practices 1,2,3 . For example, it is widely recognized that algorithms tend to underperform when applied to populations that differ from those they are trained on 4,5,6 . To counter this generalization gap, many researchers have increased the diversity represented in datasets used for AI development 5,7 . Others have presented possible technical solutions of generalizability, such as improved data preprocessing 8 , neural network normalization algorithms 9 , and an assortment of training strategies 10 .
Compared to the level of attention given to improving the generalizability of machine learning models, there has been relatively little work focusing on monitoring models deployed in production for changes in the population which may lead to failure of generalizability—so called data drift. Data drift, defined as the systematic shift in the underlying distribution of input features 11 , can cause models’ performance to deteriorate 11,12,13 or behave in unexpected ways, which can pose a threat to the safety of patients. For example, changes to the demographics of the population served over time (e.g., immigration to a city) may unknowingly change the distribution of input data to an AI model—classes which were previously not defined may now require definition. In such a situation, failing to re-train the model to also predict the novel pathologies may deleteriously impact patient safety (e.g., a chest X-ray binary classifier may now erroneously classify the novel pathology as normal). Drift detection enables healthcare providers to follow technical 14,15,16 and regulatory 17 best-practices guidelines for machine learning which require a model be thoroughly evaluated on the deployment population and monitored to ensure safety—detection of drifts would indicate potential risk and trigger re-evaluations. Detecting this drift enables healthcare providers to proactively intervene before risk reaches the patient and decide if the model should be revaluated, retrained, taken offline, retired or replaced. It is therefore vital that deployed algorithms are monitored for drift in the populations they serve. Not doing so risks algorithms underperformance (in the best case), or patient safety risk (in the worst case).
Previous work focusing on drift detection in clinical settings often promotes tracking changes in model performance as a proxy for data drift 11,18,19 and explaining these drifts using post hoc analysis (e.g., SHAP values (SHapley Additive exPlanations) 11,20 ). While these approaches have multiple upsides in that they are often simple to implement, easy to interpret, and in certain situations, easy to act upon, they also suffer multiple weaknesses. First, the data to evaluate model performance can be difficult to obtain in a timely manner (e.g., instances where outcomes or diagnosis do not occur for days, weeks, or months later). In other situations, automated approaches to creating gold labels may not be available and it is cost-prohibitive to pay for human annotators to create diagnosis labels 21 . Even if automated approaches can be used to generate gold labels, they themselves may be affected by the data drift thus providing inaccurate labels and affecting the validity of performance monitoring (e.g., past work has shown increased negativity present in the clinical notes of obese patients 22,23 , a trend which may negatively impact the accuracy of gold labels created by neural language models if there is an increase in the proportion of obese patients). Lastly, there is a growing body of statistical work contesting the use of SHAP values for feature explanations 24,25,26 .
While more recent works also seek to directly detect data drift in clinical settings 19,27 , their explorations of data drift are not systematic, often do not include examples of real-world drift, and still use decreases in performance measures to demonstrate the utility of their methods. This study seeks to address many of these issues. Exploring three methods for performing data drift detection that do not rely on ground truth labels, we study: (1) how these methods perform in the face of real-world data drift, (2) how different types of demographic drifts affect drift detection, and (3) discuss the different scenarios where drift detection approaches may not be captured by tracking aggregate model performance. Our work highlights how, in addition to using data drift detection to detect performance changes 19,27 , data drift detection can also be used by practitioners to trigger re-evaluation of their models in line with best-practice clinical AI guidelines.
In this study, we perform a systematic exploration of data drift detection in AI-based chest X-ray prediction models, designed to predict diagnoses/pathologies from X-ray images, using (a) a real-world dataset with naturally occurring data drift (the emergence of COVID-19 in March 2020) and (b) synthetic drifts. We evaluate the utility of drift detection in multiple real-world scenarios to highlight when and how drift detection can be used to improve patient safety and model understanding. Furthermore, we demonstrate: (1) how drift detection can occur without a change in model performance (especially using commonly reported metrics), (2) the effect of dataset size on drift detection sensitivity, and (3) the sensitivity of the two broad approaches to drift detection (model performance-based and data-based) to different types of drift (e.g., changes in patient demographics, patient types, and pathologies).
The task of drift detection is to ascertain whether two different sets of data (source dataset and target dataset) are from the same distribution or if the target dataset has ‘drifted’ from the source dataset. In this study, we define data drift to refer to the scenario where source and target samples originate from the same context but at different times; a more in-depth discussion of data drift can be found in the next section. Practically, this is typically an on-going process which is performed throughout the lifetime of an algorithm’s deployment 28 . This is related to, yet separate from, the concept of generalizability of a model which can and should be used to evaluate the effect of different locations or time periods before deployment, typically only once.
In this study, we explored data drift using the task of chest radiograph disease classification. The dataset for this experiment is composed of 239,235 temporally performed chest radiographs (CXRs) (and associated imaging reports) collected before and after the emergence of COVID-19 at Trillium Health Partners, a high-volume, full service, three-site hospital system that serves the ethnically diverse population of Mississauga, Ontario, Canada. We used a pre-trained TorchXRayVision classifier fine-tuned to predict the presence of 14 pathologies. The complete details regarding the dataset and preprocessing can be found in the Methods section.
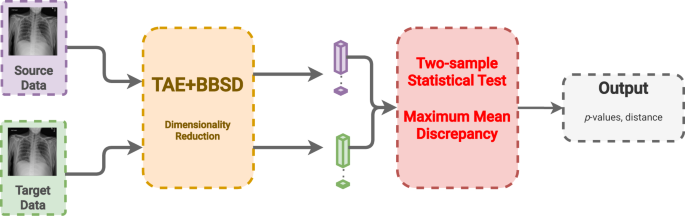
We empirically investigated and compared the efficacy of four approaches to drift-detection: (1) tracking model performance, (2) image data-based drift detection (TorchXRay Vision AutoEncoder, henceforth: TAE), (3) model output-based drift detection (Black Box Shift Detection, henceforth: BBSD), and (4) combined image-and-output-based drift detection (henceforth: TAE + BBSD). Initially, we tested the ability of these approaches to detect real-world data drift, caused by the introduction of CXRs with COVID-19 29 during the first wave of the COVID-19 pandemic. Subsequently, to assess the robustness of these approaches, we studied if they can detect synthetic categorical drifts where we simulate changes in patient demographics and pathologies. Finally, we explored the effect of sample size on the sensitivity of drift detection approaches.
Despite the common use of tracking model performance as a proxy for underlying data drift, we find that in the real-world natural experiment of data drift caused by the COVID-19 pandemic, this approach fails to capture the clinically-obvious data drift 29 . Figure 1 plots the macro-average AUROC as well as the p-value resulting from the TAE + BBSD combined image-and-output-based drift detection approach. We observe that the AUROC is relatively stable and does not meaningfully change in light of the first COVID-19 wave (represented by the vertical yellow line). On the other hand, TAE + BBSD detects the drift caused by the introduction of COVID-19 and the end of the first wave (though with a delay). This result seems to indicate that aggregate measures of performance are not a reliable proxy for detecting data drift (something which is expected and confirmed in later experiments). This is expected because the primary purpose of tracking model performance is not to detect drift; rather, any drift which does not affect model performance (a list of possible reasons can be found in the discussion) will not be detected by tracking model performance alone.
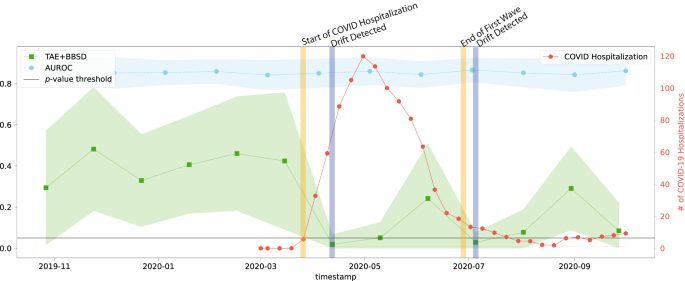
Figure 2 presents the results of drift detection experiments for various synthetic drifts where we changed the underlying patient population (demographic distribution) to simulate data drift. Supplementary Fig. 2 has a similar experiment where the prevalence of pathologies was changed (instead of demographics) to simulate data drift. For each simulated data drift, we study the effect of varying amounts of data drift (from 5% increase to 50% increase). Each subplot presents the AUROC of the classification model on the right y-axis, and the results of the image data-based drift detection (TAE), model output-based (BBSD), and image-and-output-based detection (TAE + BBSD) on the left y-axis.
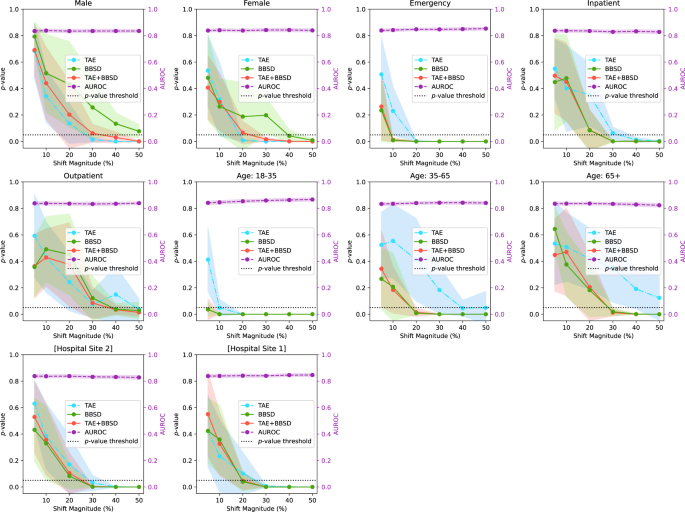
As observed with the COVID data drift, the AUROC is relatively stable for most of the synthetic drifts tested. This lends credence to our observation that aggregate model performance is not a reliable indicator of data drift (despite widespread use). In Supplementary Figs. 3–10, we plot other metrics (F1 score, precision, recall, and Brier score) to demonstrate the consistency of our finding. For these metrics we observe similar results: all are less sensitive than data-based drift detection approaches.
For TAE, BBSD, and TAE + BBSD, we observe that the larger the size of the synthetic drift the increased likelihood of the drift being detected. We also observe that, generally, using TAE + BBSD is usually more sensitive than just TAE and BBSD is nearly as sensitive as TAE + BBSD.
Interestingly, we can see that the sensitivity of TAE, BBSD, and TAE + BBSD varies substantially depending on the synthetically enriched feature. For example, a 5% increase in the number of patients aged 18–35 is detected by TAE + BBSD, yet it takes a 30% increase in inpatients or patients aged 65+ for the observed drift to be considered significant. It is not clear why this is the case. Initially we hypothesized that increases of rarer classes are easier to detect than increases of majority classes; patients 18–35 are only 6% of the population whereas patients 65+ are 62% of the population, Supplementary Table 1. However, this trend is reversed when looking at patient classes; inpatients are the most common patient class (57% of patients) yet are better detected than outpatients (19%). Alternatively, the level of discrimination between different groups (e.g., the variance of groups) may require a larger number of samples to detect differences 30 . More work is required to uncover the causes of these differences.
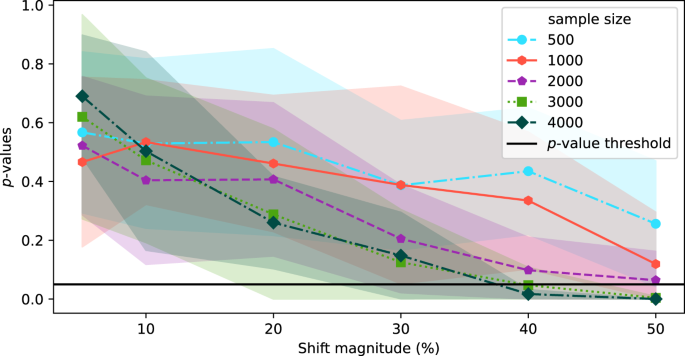
In the above experiments, the source and target datasets included 4000 images each. In this section, we explore the effect of sample size on the sensitivity of TAE + BBSD. Figure 3 plots the output of TAE + BBSD across various magnitudes of data drift (increasing the proportion of male patients) for various sample dataset sizes. We observe correlation between the sample size and the sensitivity of drift detection: with a sample dataset size of 500 the p-value never drops below 0.1 and with 4000 images the p-value drops below 0.05 with a 40% increase. This finding has direct implications for the practical use of drift detection techniques: if it takes days (large radiology providers) or months (smaller providers) to perform 4000 new CXRs, then existing techniques for drift detection may not be timely enough to allow clinicians using the tool to intervene promptly.
In the initial set of experiments, following from prior literature 19,31 , we reported model performance using AUROC. Unfortunately, the AUROC did not substantially change in the presence of any drift (both in the natural example of COVID-19 or in the majority of synthetic shifts). To understand why this is the case, Fig. 4, plots different performance measures: macro-average AUROC, macro-average F1 score, macro-average precision, macro-average recall, macro-average Brier score, and the F1 score breakdown for multiple pathologies for a synthetic shift increasing the proportion of patients from [Hospital Site 1] and [Hospital Site 2]. In the Supplementary Figs. 3–8, we plot the change in macro-average precision and recall for each of the tested drifts. Supplementary Figure 12 plots the change in performance measures for various degrees of data drift.
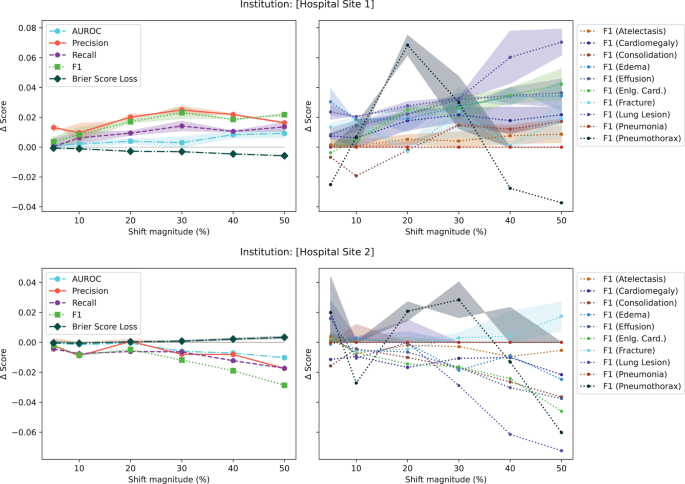
This experiment highlights three main observations. First, triple-aggregated performance measures (Fig. 4, AUROC and F1 in left subplots) which rely on the aggregation of multiple metrics (e.g., macro-average AUROC which is calculated using two other metrics: false and true positive rates, or F1-Scores which is calculated using precision and recall) across multiple classes are the least useful for drift detection. Second, individually aggregated performance measures (e.g., Fig. 4, precision, recall, and Brier Score in left subplots) are more sensitive to tested drift compared to triple-aggregated measures, but this depends on the type of drift. Lastly, the performance measures of individual classes (Fig. 4, right subplots) are the most likely to be sensitive to data drift (even doubly aggregated performance metrics).
Monitoring a deployed AI model is crucial in high stakes scenarios such as healthcare to ensure that any performance degradation is detected early and acted upon before patient care impact 32,33 . Current best practice includes comparing the AI model’s outputs (or a sampling of the outputs) against a gold standard continuously over time 34 . The intent is to detect clinically important changes which might have been caused by changes in the underlying population of patients, disease prevalence, equipment changes, practice/referral pattern among many other factors, and facilitate intervention (retain, warn users, retire model) promptly 6,28,35 .
While monitoring of model performance is a must, we argue that those using clinical AI should also use approaches which look at the input data directly to monitor for data drift for reasons related to safety, cost and reliability. This is because many types of data drift—used in this work loosely to encompass any type of drift that may occur (e.g., covariate shift, label shift, and concept drift) 16 —cannot always be detected by tracking performance metrics alone. For example, unless there is an extreme disparity in performance between classes, tracking performance metrics alone will not likely capture covariate shift (i.e., changes in input distribution), in contrast, we have shown, in this work, TAE is capable of doing so.
To clinically motivate the need for the approaches presented in this study, Table 1 presents multiple scenarios where data drift detection can positively impact clinical model deployment. For example, data drift detection is useful for patient safety when it is not feasible to rely on performance monitoring for timely evaluation (e.g., Scenario 1: when outcomes do not occur for days or weeks or it is cost-prohibitive to consistently produce gold-standard labels in a timely manner 21,36 ). In this scenario, drift detection provides a method for tracking instances of data drift which can be used to trigger the more expensive process of data labeling for re-evaluation (i.e., only incur the cost for full evaluation when a drift is detected) to ensure patient safety. In instances where there is less time pressure (i.e., applications with longer time-frames to evaluate outcomes), data drift detection may be of less importance to ensuring patient safety, though it may be worthwhile to gain a better understanding of the patient population.
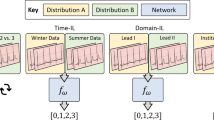
While the COVID-19 drift represents a real-world example of a drastic change in the patient population receiving imaging, similar changes in the underlying data distribution could occur due to a variety of different factors (e.g., immigration, aging population, etc.) and in a less drastic manner. As such, we examine how our drift detection works in other scenarios to determine if our findings can be generalized. To this end, we simulated the creation of synthetic drifts by sampling from our dataset and changing the demographics of the target dataset (e.g., increasing the proportion of young patients).
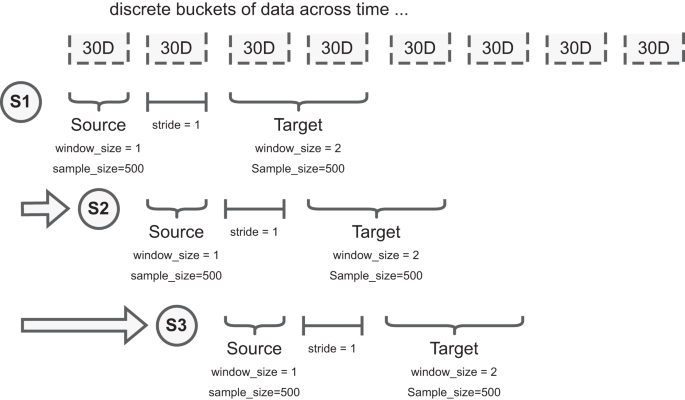
For the synthetic categorical drift experiments, we first define the source dataset as a stratified random sample of the overall patient population. For our experiments, we chose to stratify across the following representative categories: sex, institution (which of the two hospitals part of [Institution Name] the images were taken), is_icu (whether the patient was admitted to the ICU), patient age, and patient class (whether the patient was an outpatient or inpatient).
The distribution of the source dataset never changes. We then synthetically enrich the target dataset, a dataset with the same sample size as the source dataset, which includes two subsets of data sampled differently. The first subset is sampled using the same methodology for the source dataset. The second subset is composed of samples belonging only to the specific category being studied (e.g., male sex). For example, if our source dataset is 500 images and we are looking to explore the effect of a 10% increase in male patients, for the target dataset, we would sample 450 patients (90%) in the same manner as the source dataset for the first position of the data and add 50 male patients (10%) randomly sampled from the rest of the dataset to form the second subset of the data.
By never changing the sampling procedure of the source dataset, and slowly increasing the %of enriched samples in the target dataset, we are able to test the sensitivity of data drift approaches (described below). In the target dataset, we start with a 5% drift and keep increasing the percentage of samples iteratively (up to 50%), as illustrated in Supplementary Figure 13. In each iteration, we repeat this sampling procedure 10 times to calculate confidence intervals. To ensure the validity of the statistical test and avoid multiple tests, each dataset is composed of unique images for each statistical test.
Due to the correlation between categorical features in the data, we also monitor the increase of categorical variables that are not the intended target for the distribution shift to ensure we comprehensively catalog the changes caused in the synthetic drift. For instance, if the target category is positive instances of Pneumonia, this may also correlate with other pathologies, such as Lung Opacity, that are symptomatic of the target category 49 ; this is to be expected and unavoidable due to the limitations of the size and diversity of the dataset. The proportion of the increase in non-target categories for each experiment that rises above a tolerance of 5% from the proportions in the full source dataset is included in the supplemental material (Supplementary Tables 2 and 3).
With the experimental setup defined, we test the ability of model performance monitoring to detect data drift in addition to three drift detection approaches: (1) image data-based drift detection, (2) model output-based drift detection, and (3) combined image-and-output-based drift detection. The CyclOps package was used to conducted the experiments 50 .
Tracking model performance (i.e., performance-based drift detection) is commonly used to detect if input distributions have shifted. Intuitively, if the performance of the model falls below (or exceeds) expected norms, it is suspected that the inputs to the model (i.e., the data) has changed. In this work, we monitor the performance of a TorchXRayVision model (described below) fine-tuned on a small subset of patient X-ray images (n = 10,000, which were not used in the rest of the work). We measure performance using AUROC, F1, precision (alternatively: positive predictive value), and recall (alternatively: sensitivity) because these are the most commonly reported metrics in the relevant literature (i.e., past work on chest X-ray classification and data drift detection). We also include the Brier Score Loss (i.e., Brier Score) in our experiments as a measure of calibration metrics.
In cases where there are not enough predicted positive or negative instances for a given pathology (machine learning task described below), we exclude those classes while measuring the model performance.
Image data-based drift detection (also: feature/covariate shift detection) describes an approach to detect drift by comparing the set of images in the source and target datasets directly. To do this, the patient chest radiographs are passed into a convolution neural network autoencoder to build image representations (i.e., reduce the dimensionality to a feature vector with 512 dimensions). In this work, we use a pre-trained TorchXRayVision AutoEncoder (TAE) 51 . After building the representation of each image, we compare the reference and target datasets using the multivariate maximum mean discrepancy (MMD) statistical test 46,52 .
MMD is a nonparametric statistical technique for detecting distributional differences between two samples 53 . As demonstrated by Rabanser et al. 46 , the p-values are calculated by computing the maximum discrepancy between two distributions and comparing via permutation tests to a null-hypothesis distribution.
Model output-based drift detection is a method to detect drift using only the output of the classifier without any gold labels 46 . Rather than reducing the dimensionality of the images using an auto-encoder, this approach reduces the dimensionality of the images through the act of classification into a vector with a length equal to the number of predicted classes (14 in this case). To clarify related concepts, data drift using BBSD uses the model predictions as a proxy for data changes, while target drift (similar concept) would describe changes in the ground truth outcomes (e.g., decrease in bilateral pneumonias from introduction of the COVID-19 vaccine). Likewise, BBSD is different from performance-based drift detection as we do not require any gold labels for this method, only the predicted outputs. Like with TAE, after dimensionality reduction we compare the reference and target datasets using the MMD statistical test 46,52 .
In this last approach, we combine the previous two approaches using the images (TAE) in conjunction with the model outputs (BBSD). For the images, we reduce their dimensionality using the aforementioned TAE. The classifier is used as a black-box shift detector (BBSD) 54 , hence TAE + BBSD. These two outputs (from the autoencoder and the classifier) are normalized independently, concatenated and used as the final feature vector for performing the statistical test with the chosen test method, MMD, Fig. 6. Comparing the performance between TAE, BBSD, and TAE + BBSD enables us to observe if the type of drift captured by the auto-encoder differs from the drift captured by the classifier.
The classifier used for the performance monitoring and BBSD is the classifier from the TorchXRayVision library 51 . The pre-trained version of the TorchXRayVision used in this study was pre-trained on the MIMIC-CXR dataset 55 . The model architecture is a Densenet-121 convolutional neural network that takes an input of 224 × 224 images and outputs a set of 14 predictions.
We further trained and fine-tuned the model on [Institution Name]’s training set and used a validation dataset for early stopping and hyperparameter tuning. The training set was composed of 10,000 scans of unique patients from January 2016 to June 2016 and validated on data from July 2016 to December 2016. There was no patient overlap between the source and target sets for both the COVID and synthetic drifts experiments. A table with model performance metrics can be found in the Supplemental Materials.
The pre-trained TorchXRayVision autoencoder was trained on numerous chest radiograph datasets (PadChest 56 , Chestx-ray8 57 , CheXpert 31 , and MIMIC-CXR 55 ). The auto-encoder takes in images of size 224 × 224 and uses a resnet-101 backbone to reduce the dimensionality of the image to feature map of size 4 × 4 × 512. This feature map is then fed into an inverted resnet-101 backbone, the objective is to reconstruct the input images so that the feature maps at the bottleneck of the network contain useful information about the scans. For the experiments, we take the feature map produced by the autoencoder and perform mean pooling to produce a 1 × 512 feature vector for each scan.
All stages of the research were conducted by local researchers. The study was deemed locally relevant by the Institute for Better Health and the protocol was approved by the research ethics board (#1031).
Further information on research design is available in the Nature Portfolio Reporting Summary linked to this article.
The dataset from this study is held securely in coded form at the Institute for Better Health, Trillium Health Partners and is not openly available due to privacy concerns. However, access may be granted to those who meet criteria for confidential access, please contact Mohamed Abdalla or Benjamin Fine (at first.last@thp.ca).
All code used to create all experiments in this study can be found publicly available at https://doi.org/10.5281/zenodo.10652201
We would like to thank the TD Ready Commitment and Digital Supercluster Canada which provided financial support to B.F. Neither had say in the decision to pursue or the decision to publish this research.